We’re in the last week prior to the 2013 All-Star Break, and with it will come the usual pronouncements of some player setting a record for most ____ by the Break. Now of course, the actual date of All-Star Break moves around quite a bit, but its generally the beginning of the second week of July. Here’s a breakdown of the actual dates of the All-Star Game, excluding 1981 (when it was held after the end of the strike) and the dates of the second of the two games played each year from 1959-1962:
| DATE OF ALL-STAR GAME |
| DATE |
Count |
Pct. |
| 7/11 |
11 |
13.9 |
| 7/13 |
11 |
13.9 |
| 7/10 |
9 |
11.4 |
| 7/9 |
8 |
10.1 |
| 7/12 |
7 |
8.9 |
| 7/8 |
7 |
8.9 |
| 7/14 |
5 |
6.3 |
| 7/7 |
5 |
6.3 |
| 7/15 |
4 |
5.1 |
| 7/6 |
4 |
5.1 |
| 7/16 |
2 |
2.5 |
| 7/23 |
2 |
2.5 |
| 7/17 |
1 |
1.3 |
| 7/19 |
1 |
1.3 |
| 7/24 |
1 |
1.3 |
| 7/25 |
1 |
1.3 |
| Total |
79 |
100.0 |
Take that and add in that fact that the teams all play a different number of games prior to the break, and it renders “Most ____ by the Break” statements kind of weak (at least without many caveats). Here is the percentage of each season’s games actually played prior to the Break from 1933-2012, excluding strike years:
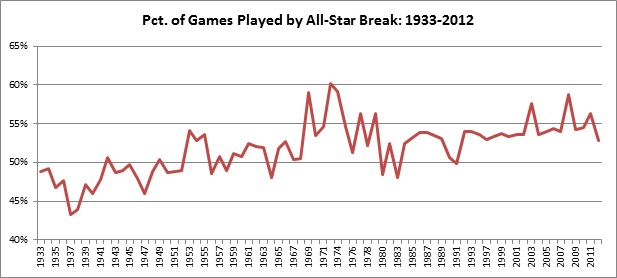
As you can see, prior to the 1950s, the Break generally occurred with less than 50% of the season completed. That dramatically changed during the last 60s and early 70s, before dropping back under 50% in the early 1980s. The percentage has been trending upward since then, with the last season that had a break before 50% of games played occurring in 1991. (This represents games actually played based on rainouts/postponements, rather than the original schedule, but the percentages based on the original schedule didn’t differ significantly.)
Read moreWho Moved My All-Star Break?